
Google Sheets Tables are structured data ranges that offer several advantages over regular data ranges. Tables have built-in features like filter controls, easy sorting, and automatic formatting, making data manipulation more efficient and intuitive. They automatically expand when you add new data, making them dynamic and responsive. Let’s examine each of these features.
Contents
Enhanced Structure
Tables in Google Sheets ensure you use proper technique when creating a table.
Title and Headers
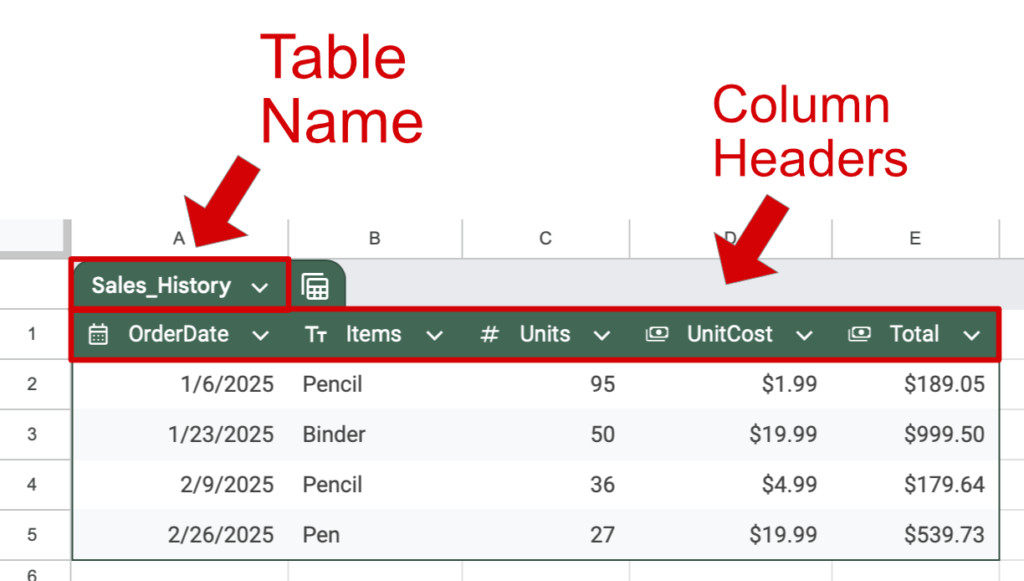
Tables require a name for the table and column headers in the first row. Think of this header row as a series of labels for your columns. Each label should describe the data in its respective column.
Column Types
Data types are not enforced in a typical spreadsheet, leaving the data more open to potential errors. However, you can define the data types in a Google Sheets Table. The user will see a warning if their data is in an incorrect format.
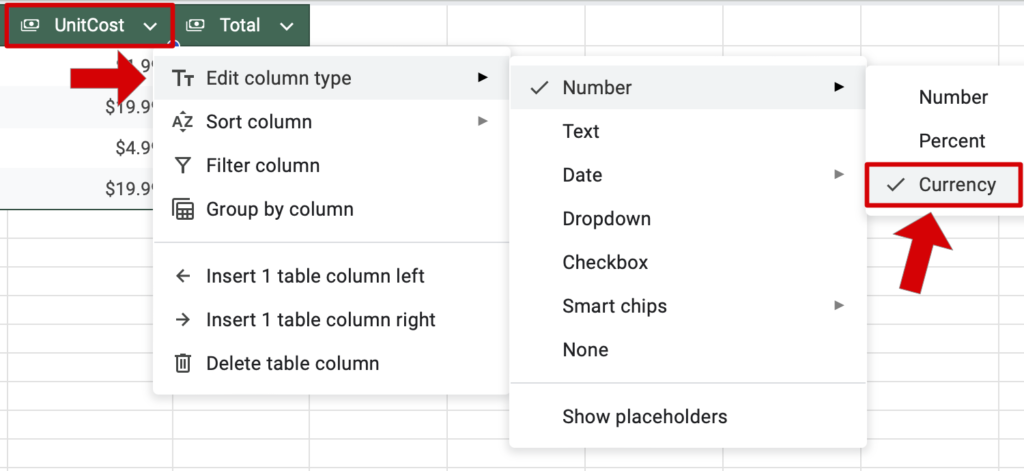
Columns should only have one type of data in them. For example, the UnitCost column should be Currency. Learn more about data types in Google Sheets in this article.
Defined Boundaries
Tables clearly define where the columns and rows begin and end. This is important when you use Table references, which we will discuss later in this article.
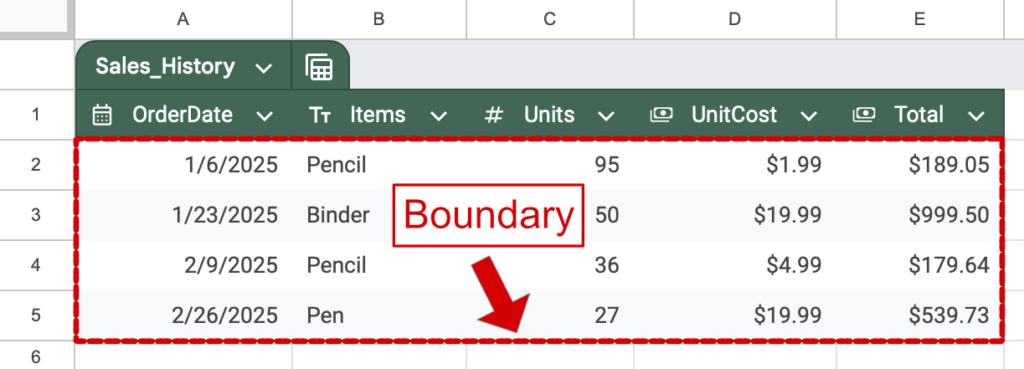
Any data below row 5 or to the right of row E in the image above is not part of the table.
Dynamic Column and Row Management
The header drop-down menus offer options for working with the table data. These options ignore any other spreadsheet content.
Sorting and Filtering
Use the drop-down menus to sort rows alphabetically, numerically, or by color. You can filter data to display only certain rows that meet specific criteria.
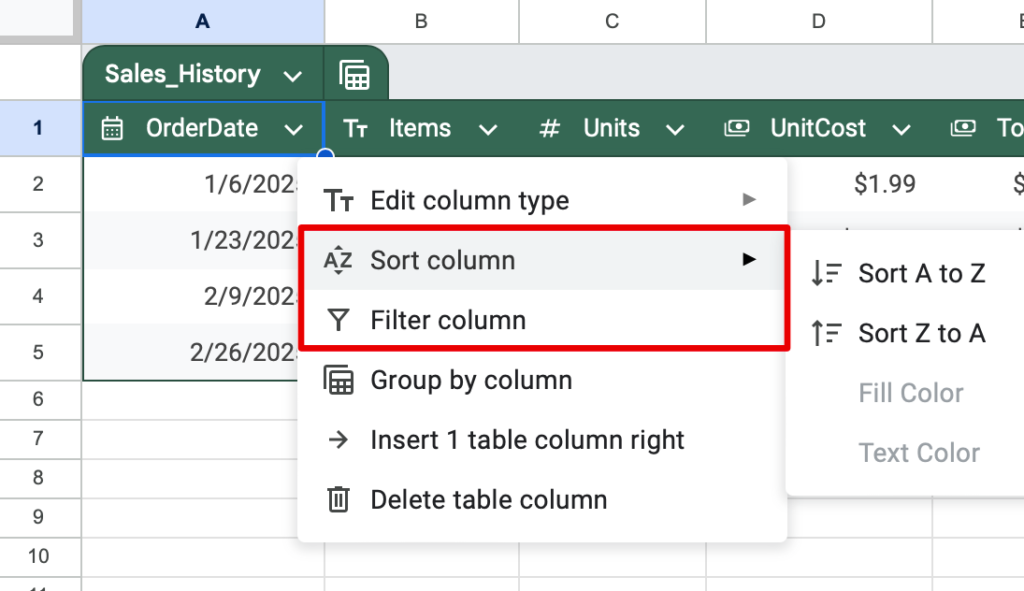
These sorts occur entirely within the table, leaving the surrounding data unsorted. This containment is helpful when your sheet contains other data, such as pivot tables or charts.
Group by Column
Grouping by column is a powerful new feature.

Let’s group this data by the Items column.
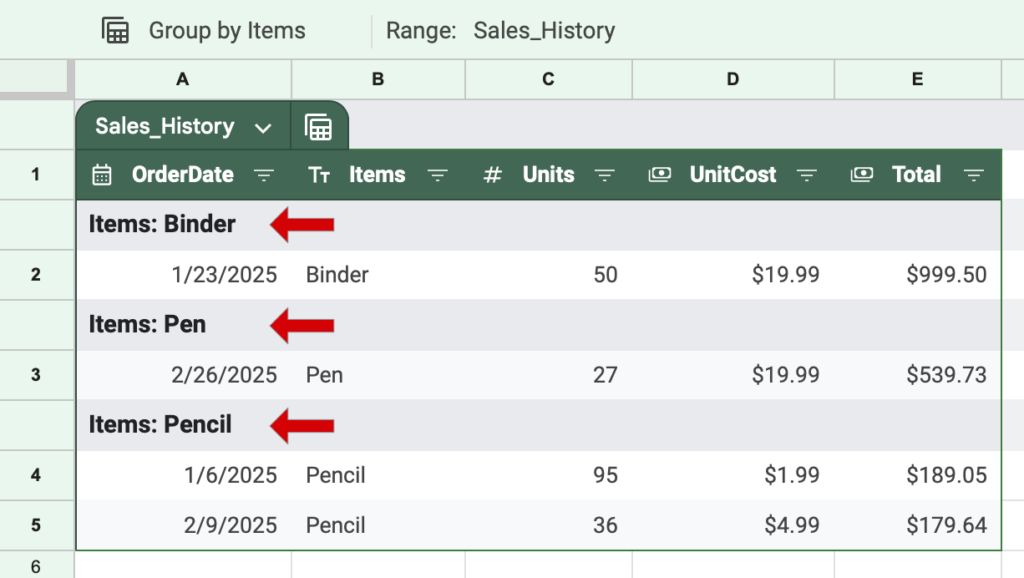
Now, each Item has its own group. However, this feature is more helpful on larger tables.
Insert and Delete Columns
You can control the number of columns as well.

Adding or deleting columns only impacts the inside of the table, leaving the surrounding cells intact.
Table Reference Syntax
The Table feature in Google Sheets introduces a new type of reference called a Table reference. Table references utilize the table structure discussed previously in this article. Now, you can reference an entire table or a column inside a table.
The easiest way to create these references is to type the = sign and then click on the table data you want. However, you can also type these references. First, type the name of the table, then the element you want as such:
(Table Name[Column Name])
To reference the Total column, use this syntax: (Sales_History[Total]), where Sales_History is the Table Name and Total is the Column Name.
=SUM(Sales_History[Total])
Using Formulas with Tables
Formulas can seamlessly interact with table data. Functions like SUM, AVERAGE, and FILTER work effortlessly with table columns and automatically adapt to table size changes. Let’s look at an example formula that exploits Table References.
In this formula, we will multiply the Units by their UnitCost.
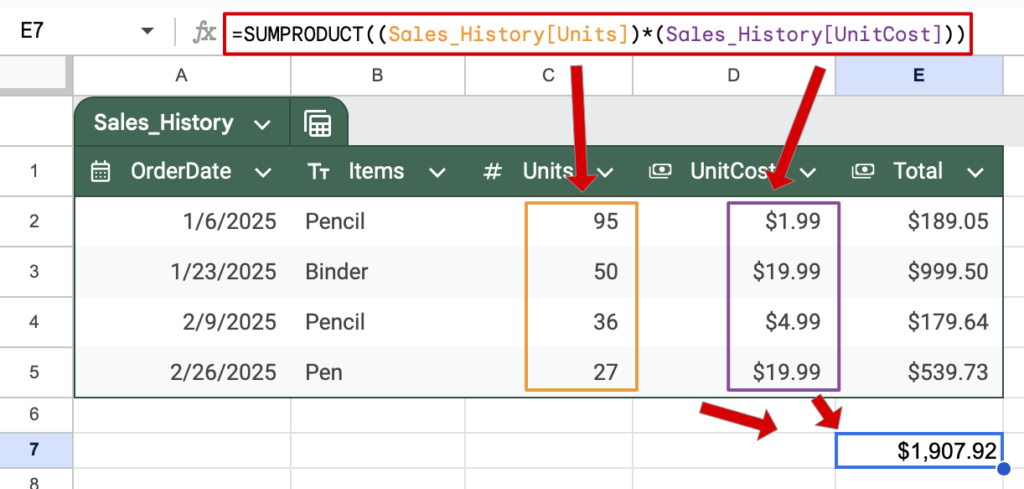
Formula used: =SUMPRODUCT((Sales_History[Units])*(Sales_History[UnitCost]))
As you can see, table references enable dynamic and accurate formulas that are impossible without them.
Video Tutorial

Conclusion
Tables in Google Sheets introduce powerful new ways to interact with your data. Consider using a table to work more efficiently and accurately when you use structured data.