
Choosing the right warehouse or distribution center location can save your business thousands of dollars annually in fuel costs, labor hours, and delivery times. Whether you’re opening your first facility, adding a regional hub, or relocating an existing warehouse, the location decision directly impacts your bottom line through transportation efficiency.
The traditional approach involves manually calculating distances to customer locations, creating complex spreadsheets with formulas, or paying for expensive logistics consulting. There’s a simpler way: use Route Matrix in Google Sheets to analyze all potential locations simultaneously and identify the optimal choice in minutes.
Contents
- 1 The Warehouse Location Problem
- 2 Setting Up Your Location Analysis
- 3 Understanding the Results Matrix
- 4 Calculating the Business Impact
- 5 Advanced Analysis Techniques
- 6 Beyond Warehouses: Other Location Decisions
- 7 Getting Started with Route Matrix
- 8 Frequently Asked Questions
- 9 Make Data-Driven Location Decisions
The Warehouse Location Problem
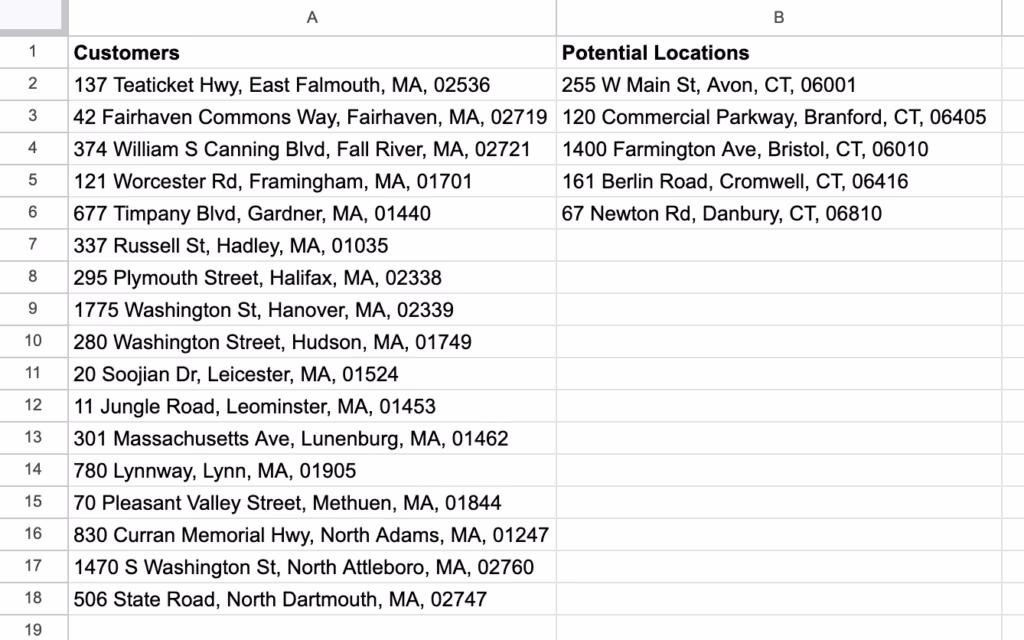
Imagine you run a distribution business serving 17 customers across Massachusetts. Your current warehouse lease is ending, and you’ve identified five potential locations in Connecticut. Each location has similar lease costs and square footage, so the decision comes down to logistics efficiency.
You need to answer one critical question: which warehouse location minimizes total driving distance (or time) to all your customers?
Manually calculating this would require 85 individual distance lookups (17 customers × 5 potential locations). Even using online mapping tools, this process takes hours and is prone to data entry errors. Route Matrix automates the entire analysis.
Setting Up Your Location Analysis
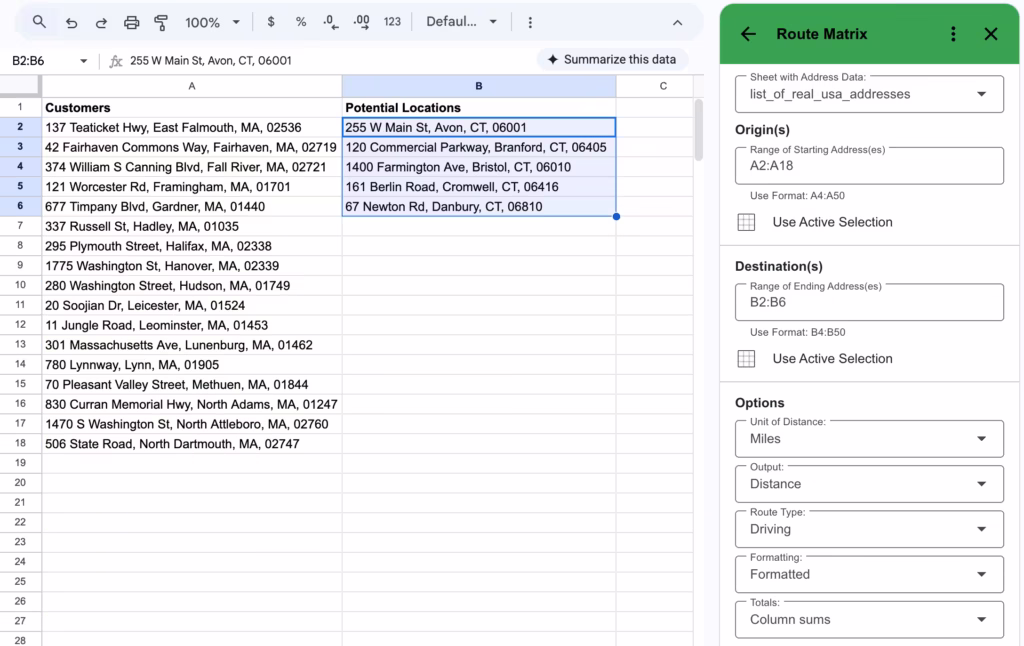
Start by organizing your data in Google Sheets. Create two lists: your customer addresses in one column and your potential warehouse locations across the top row. The addresses can be full street addresses, city names, zip codes, or even latitude/longitude coordinates – anything Google Maps can interpret.
For this example, we’re analyzing five potential Connecticut warehouse locations: Avon, Branford, Bristol, Cromwell, and Danbury. The customer list includes 17 delivery addresses spread across eastern Massachusetts, from East Falmouth in the south to North Dartmouth in the southeast, covering the typical service area for a regional distributor.
Once your addresses are entered, open Route Matrix from the Extensions menu (installation video if needed). Select your origin addresses (the customer locations) and destination addresses (the potential warehouse sites). Choose whether you want distance in miles or kilometers, or travel time in minutes. For warehouse location decisions, distance is typically more useful since it directly correlates to fuel costs and vehicle wear.
Understanding the Results Matrix
After clicking RUN (or RUN FAST for larger datasets), Route Matrix populates your spreadsheet with a complete distance matrix. Each cell shows the driving distance between one customer location and one potential warehouse site.
The real power comes from the column totals at the bottom. Route Matrix automatically sums each column and applies conditional formatting with a green-to-red color scale. The green column represents the warehouse location with the lowest total mileage to all customers, while red indicates the highest.
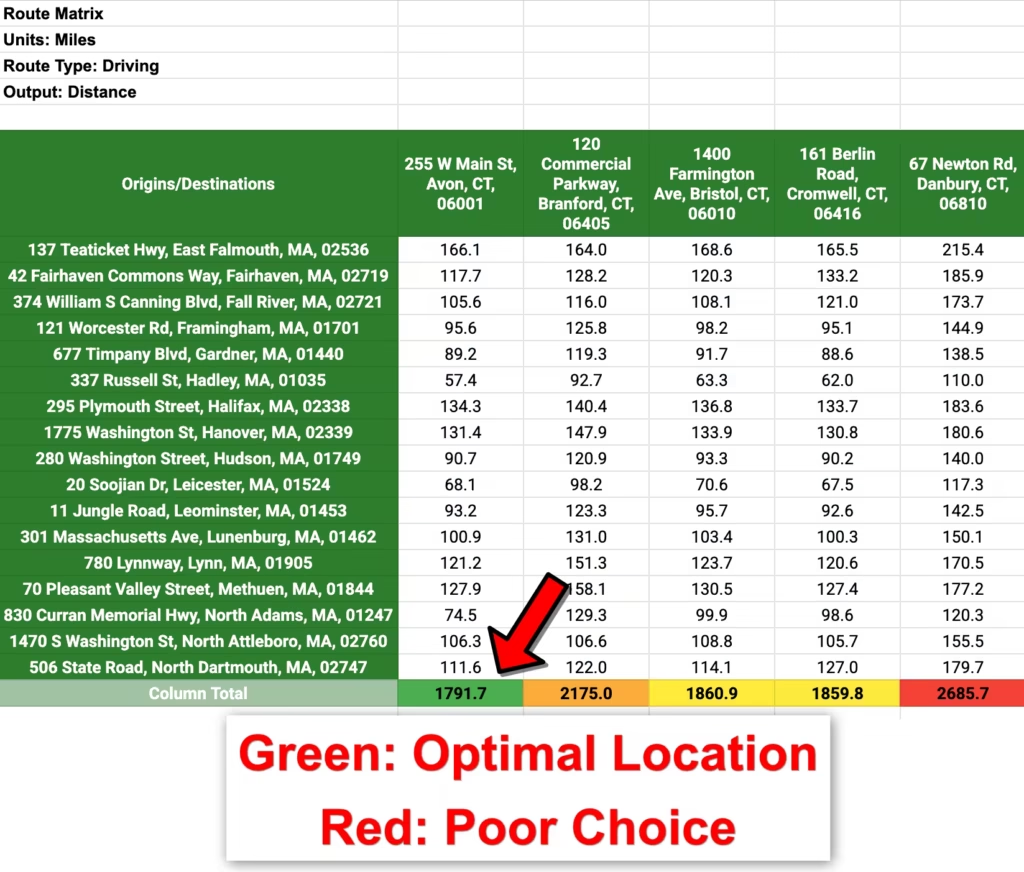
In our example, the Avon location shows 1,791.7 total miles in green, making it the optimal choice. The Branford location requires 2,175.0 miles (shown in orange), Bristol needs 1,860.9 miles (yellow), Cromwell requires 1,859.8 miles (also yellow), and Danbury demands 2,685.7 miles (red). The visualization makes the answer immediately obvious without requiring any additional analysis.
Calculating the Business Impact
The difference between the best location (Avon at 1,791.7 miles) and worst location (Danbury at 2,685.7 miles) is 893.9 miles per complete delivery cycle. If you serve all customers weekly, that’s 46,483 miles per year – equivalent to driving around the Earth nearly twice.
Using the IRS standard mileage rate of $0.67 per mile (which accounts for fuel, maintenance, depreciation, and insurance), choosing Avon over Danbury saves $599 per delivery cycle. For weekly deliveries, that’s $31,148 in annual savings. Over a typical five-year lease term, the location decision impacts costs by more than $155,000.
These savings compound when you factor in driver time. At an average commercial driving speed of 35 mph including stops, those 893 extra miles represent 25.5 additional hours of labor per cycle. With driver wages and benefits averaging $28 per hour for commercial drivers, that’s another $714 weekly or $37,128 annually.
The analysis becomes even more valuable when comparing locations with similar total distances. Bristol (1,860.9 miles) and Cromwell (1,859.8 miles) are nearly identical in aggregate, but examining individual customer distances in the matrix reveals which location serves your highest-volume customers more efficiently. If your top five customers by order volume are concentrated in central Massachusetts, Cromwell might be preferable even though the total distances are similar.
Advanced Analysis Techniques
Route Matrix allows you to switch between distance and time calculations, which reveals important differences during peak traffic hours. Running the same analysis with travel time instead of distance might show that Branford, despite being farther in total miles, offers faster highway access and lower travel times during typical delivery windows.
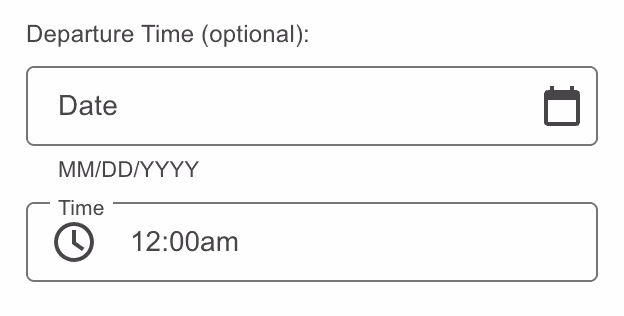
For businesses serving customers at specific times, Route Matrix supports departure time specifications. This feature helps you understand how traffic patterns affect delivery windows. A warehouse location might look optimal based on pure distance but become problematic if morning rush hour significantly increases delivery times to your most time-sensitive customers.
Beyond Warehouses: Other Location Decisions
The same methodology applies to other facility location decisions. Retail businesses can evaluate store locations by analyzing distances to target demographic clusters. Service companies can position field offices to minimize technician travel time to service territories. Sales organizations can place regional offices to optimize account coverage.
The technique also works in reverse – instead of choosing a facility location, you can determine optimal sales territories. Put your sales representatives’ home addresses in the columns and customer locations in the rows to see which rep is closest to each account, enabling fair and efficient territory assignments.
Meeting planners use Route Matrix to find the fairest gathering location for distributed teams. Enter employee addresses as origins and potential meeting venues as destinations to identify which location minimizes total commute time, improving attendance and reducing travel reimbursement costs.
Getting Started with Route Matrix
Route Matrix is available as a Google Sheets add-on from the Google Workspace Marketplace. Basic usage is free for matrices up to 10 routes. Larger analyses use the RUN FAST feature, which costs $7 per 1,000 route calculations and can be purchases through the add-on. The five-location, 17-customer example shown here requires 85 calculations, costing about $0.60 to run.
Given that poor location decisions can cost tens of thousands annually, spending less than a dollar to optimize your choice represents one of the highest-return analyses you can perform. The add-on installs in seconds and requires no technical expertise – if you can enter addresses in a spreadsheet, you can perform sophisticated location analysis.
For businesses already using Google Sheets for customer management or territory planning, Route Matrix integrates seamlessly with existing workflows. Export your customer list from your CRM, paste it into Sheets, add your potential locations, and get results in minutes rather than the hours or days required by traditional analysis methods.
Frequently Asked Questions
How accurate are the distance calculations? Route Matrix uses Google Maps routing data, the same information powering Google Maps navigation. The distances reflect actual driving routes, not straight-line calculations, and account for road networks, one-way streets, and highway access. For the most accurate results, use complete street addresses rather than just city names.
Can I analyze locations in different countries? Yes, Route Matrix works with any addresses Google Maps can interpret worldwide. You can compare warehouse locations across international borders, though be aware that different countries may have varying transportation costs that aren’t reflected in pure distance calculations.
What if some potential locations haven’t been identified yet? You can use city names, ZIP codes, or geographic landmarks as proxies for potential locations. For example, entering “Manchester, CT” represents the general area even if you haven’t identified a specific address. Once you narrow down to finalists, you can rerun the analysis with exact addresses for final validation.
How does this compare to specialized logistics software? Professional logistics platforms offer additional features like load optimization, route sequencing, and real-time traffic integration. However, for the specific question of facility location selection, Route Matrix provides the essential analysis at a fraction of the cost. Many businesses use Route Matrix for location decisions, then upgrade to specialized software only if their operations require advanced routing features.
Make Data-Driven Location Decisions
Facility location decisions have long-term financial implications that justify careful analysis. Route Matrix transforms a time-consuming, error-prone manual process into a simple, visual comparison that anyone can perform. Whether you’re opening your first warehouse or optimizing an existing distribution network, spending a few minutes with Route Matrix can save thousands in annual operating costs.
The conditional formatting visualization makes optimal locations immediately obvious, but the complete distance matrix provides the detailed data needed to explain your decision to stakeholders. When presenting to executives or investors, showing the concrete mileage savings and cost reductions makes your location recommendation defensible and data-driven.