
Systematic sampling involves choosing a random starting point and selecting every nth item from your data set. Here’s how to do it in Google Sheets using two approaches.
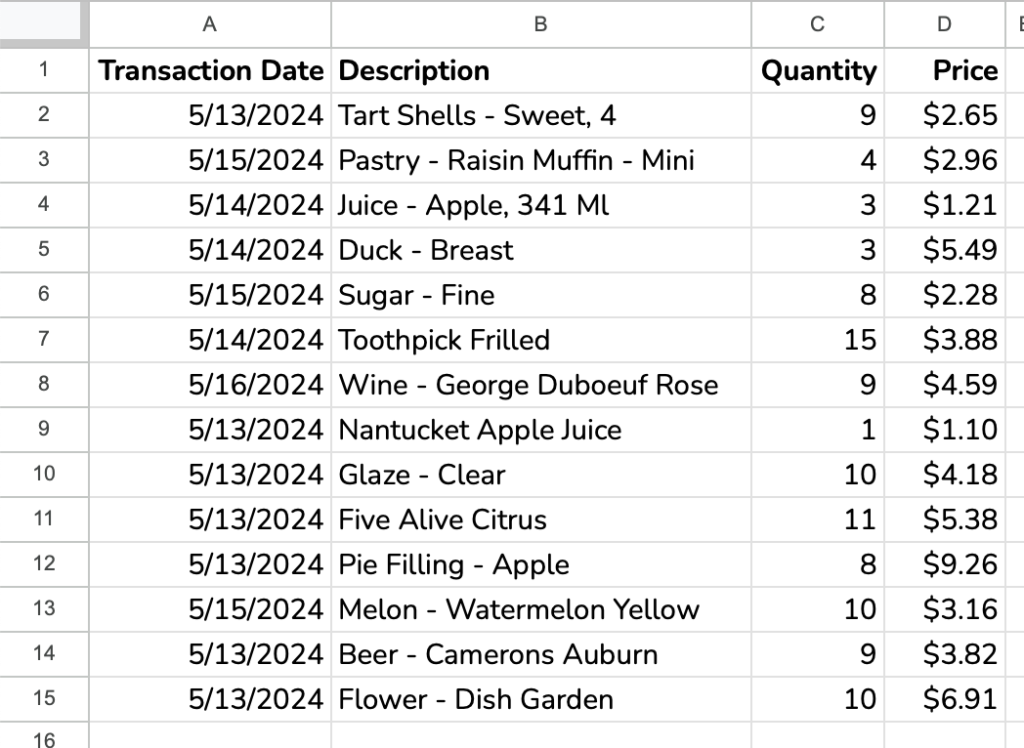
We’ll use the data and formulas stored in this Google Sheet. Make a copy for yourself to follow along. We start with the list of transactions below in A2:D15 as our population. Note that we’ll ignore row 1 as that is our header, which is not part of the population.
Contents
Method 1: Using Formulas
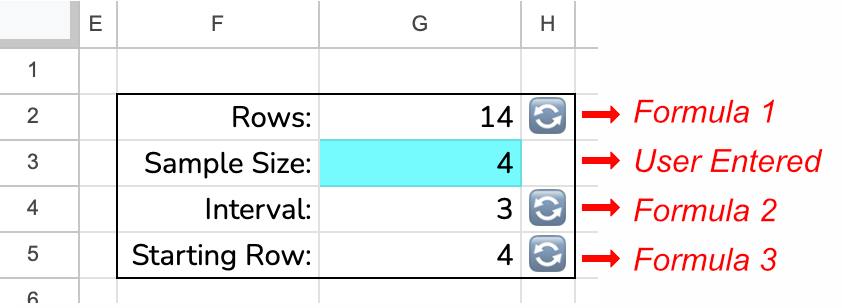
This first method is more complex, but it can be done without an add-on. To start, you need to know the sample size. The formulas will calculate the rest. Enter your desired sample size into cell G3 in the spreadsheet.
Sampling Parameters
Enter your Desired Sample Size
For this tutorial, we’ll say the desired sample size is 4. You need to input this number; the rest of the numbers come from formulas.
Formulas 1 through 3 calculate the number of rows, the sampling interval, and the starting row. Let’s look at each of these formulas.
Formula 1: Find the Nuber of Rows
We’ll use the COUNTA function to calculate the number of rows by counting the non-blank cells in a range.
Formula: =COUNTA(A2:A) where A2:A is the first column of the population
Note the cell reference A2:A starts at cell A2 to avoid counting the header row. Next, we’ll calculate the sampling interval.
Formula 2: Calculate the Sampling Interval
The sampling interval (n) is the number of units between each sample, including the sample. For example, an interval of 3 means you sample every third row.
Formula: =ROUNDDOWN(G2/G3) where G2 is the number of rows and G3 is the sample size.
Use ROUNDDOWN instead of ROUND to ensure you have enough samples. ⚠️ Pay attention, though; you may get too many samples. That is why row numbers are next to the sample output. Delete any extra samples in the spreadsheet.
Formula 3: Find the Starting Row
A systematic sample is less predictable if you start with a random row. The following formula will make the first sample anywhere from the first row of your population down to the nth row, with n being the sampling interval.
Formula: =RANDBETWEEN(2,(G4+1)) where G4 is the sampling interval, or n.
Create Row Numbers
The rows you choose are driven by the sampling parameters you created in the previous section of this tutorial. Row numbers will help us keep track of how many samples we’ve created. Since we rounded the sampling interval down using ROUNDDOWN, there’s a chance you need to delete extra samples.
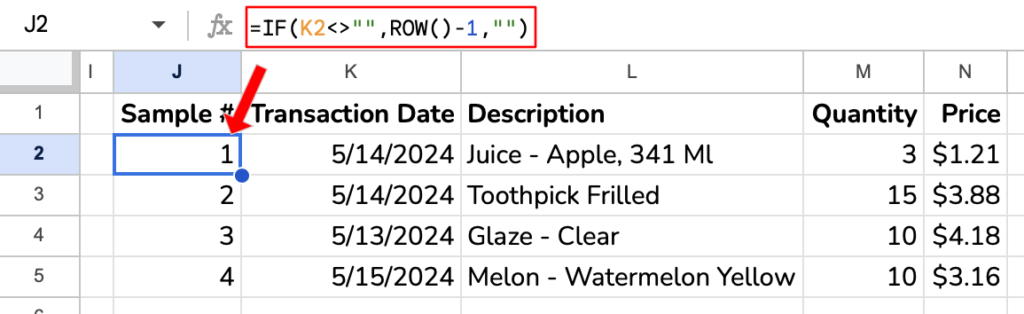
Formula: =IF(K2<>"",ROW()-1,"") where K2 is the first cell of the sample output, which we’ll discuss next.
Create the Sample Output
Now, you are ready to create your systematic sample.
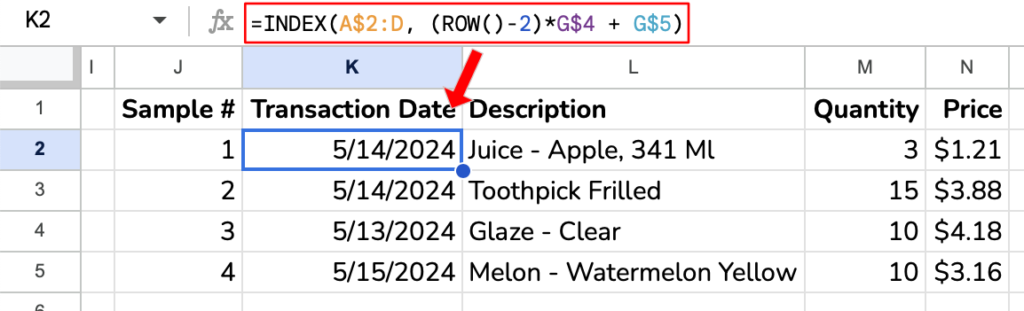
Formula: =INDEX(A$2:D, (ROW()-2)*G$4 + G$5) where A$2:D is the population, G$4 is the sampling interval (n) and G$5 is the starting row. Note the use of dollar signs to fix the row references.
Drag the formula down for the desired sample size (4 rows in our example). This formula will list the sample rows from every nth row in the population.
This technique is effective but a bit cumbersome. Next, we’ll look at an automated solution using a Google Sheets add-on.
Method 2: Using the Random Sampler Add-on
The random sampler add-on automates the sample selection process. Let’s look at the steps for a systematic sample.
This add-on offers a seven-day free trial. Please look here for pricing.
Install The Add-on
To install the add-on, go to Extensions > Add-ons > Get Add-ons. Search for “Random Sampler” and install the one by Sheets Help. Expand the side panel in your browser and click on the Random Sampler icon. See this video for more installation instructions.
Configure Sample
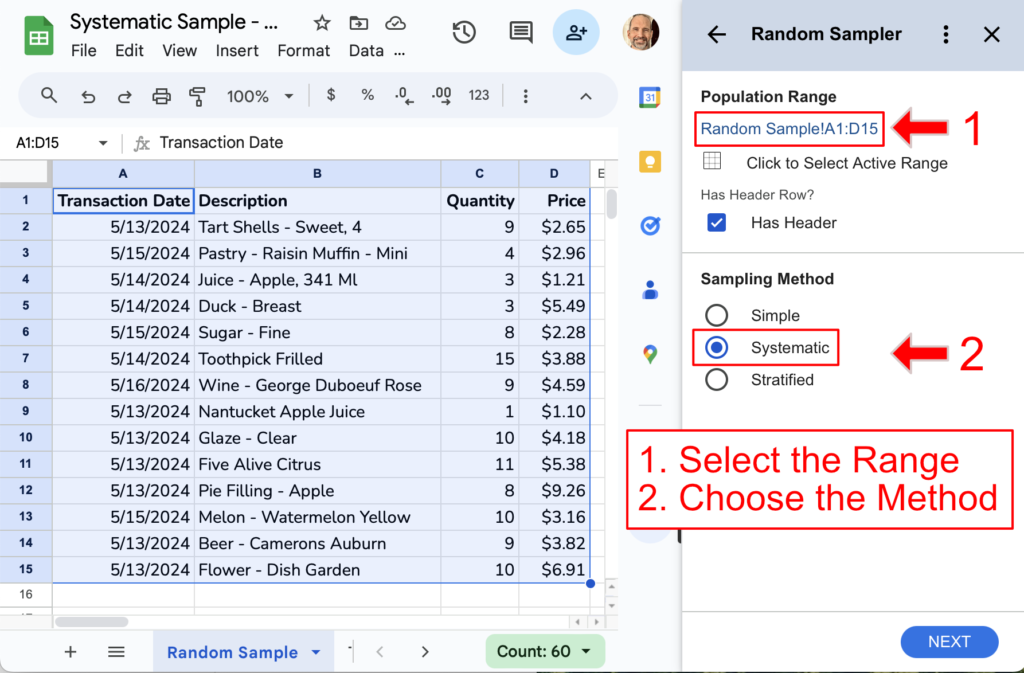
In the Random Sampler sidebar, select the data range of your population and the systematic sampling method.
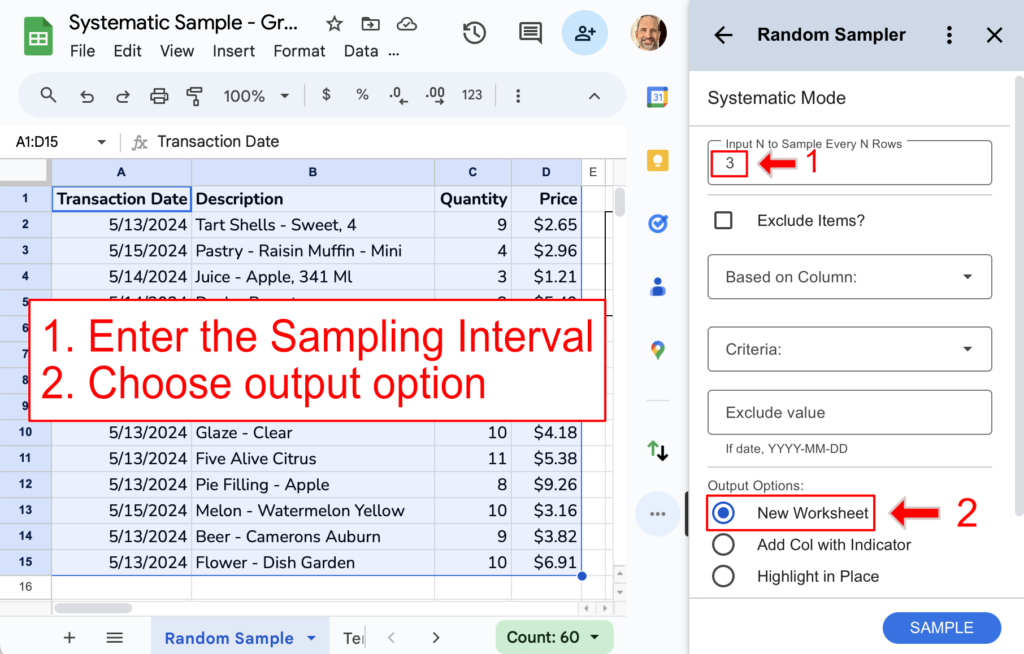
This add-on asks for the sampling interval, not the sample size. Click next, and then enter your desired sampling interval. We’ll enter 3 as the sampling interval and choose the New Worksheet output option.
Create the Sample
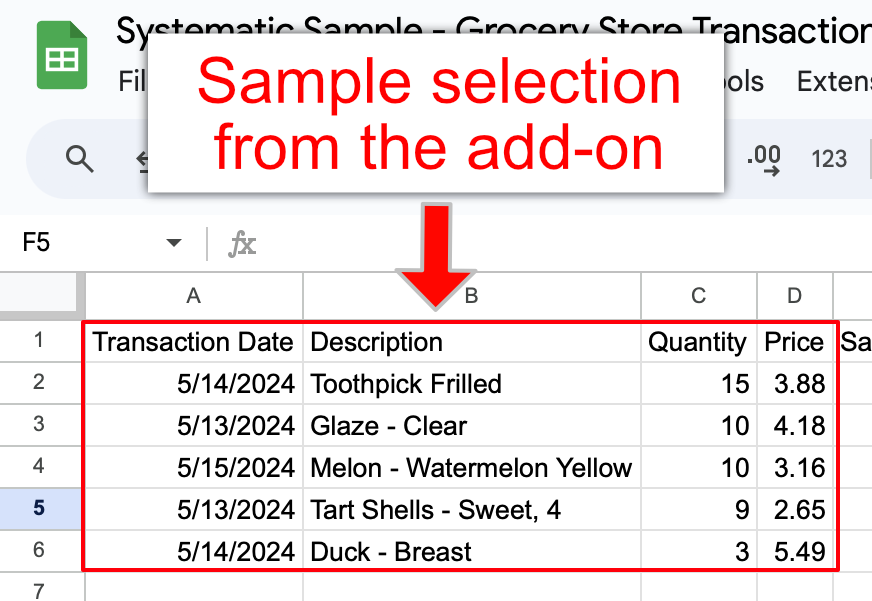
Click the Sample button, and the add-on will create the sample on a new worksheet.
Video Tutorial

Choosing a Method
- Use the function method (Method 1) if you’re comfortable with formulas and want more control over the process.
- Use the Random Sampler add-on (Method 2) for a quicker and user-friendly experience, especially for larger datasets.
Keep in mind that systematic sampling can be biased if your data has a pattern that aligns with the sampling interval. Choose the method that best suits your needs and data characteristics.
Related Articles
-
Taking a Random Sample in Google Sheets: Two Methods
Learn how to take a random sample in Google Sheets.
-
Random Sampler Google Sheets Add-on
Learn how the Random Sampler Google Sheets add-on helps you investigate your data with unbiased samples.