
Pivot tables extend the power of Google Sheets. But you can take Pivot tables one step further with Calculated Fields. This article discusses five reasons to level up a standard pivot table. Before we dig in, let’s look at the data that feeds into our example Pivot table.

This table shows sales data for several Materials, including the Amount, Price, and Cost of each transaction. We’ll use a Pivot table to summarize this data, but we’ll also add calculated fields. It is not always clear when to use a calculated field. Pivot tables have many built-in functions, including SUM, AVERAGE, and COUNT but these aren’t always enough.
Here are the top five reasons to use a calculated field in a Google Sheets pivot table instead of a built-in function:
🔗 Make a copy of the Google Sheet with these examples to follow along.
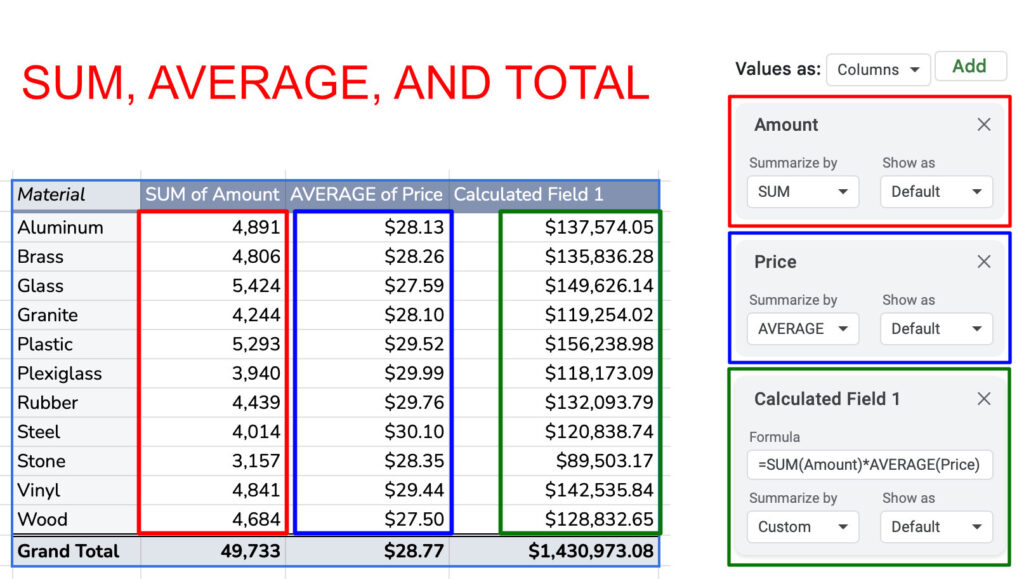
- Combine Fields: Built-in functions work on a single field. Calculated fields can reference multiple columns in the pivot table, enabling dynamic comparisons. Imagine a field showing each product’s total sales. You could calculate the total sales with the formula
=SUM(Amount)*AVERAGE(Price).
- Less Common Functions: Pivot tables standard functions are limited to a pre-defined set. Calculated fields let you use any function you like. For example, you can look for blank fields in your pivot table using the COUNTBLANK function as such
=COUNTBLANK(Amount).
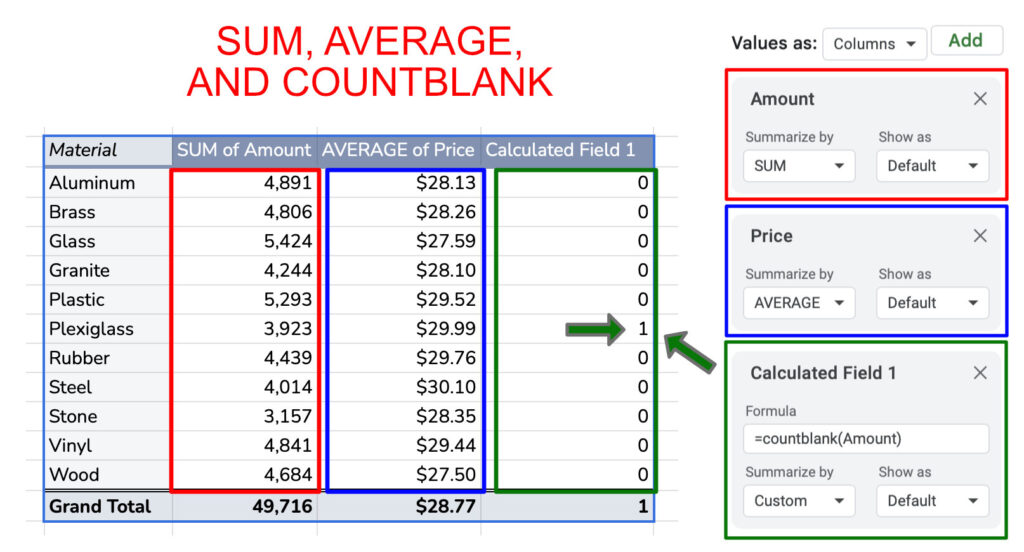
This formula returns the number of blank fields, showing one blank in a Plexiglass row. As you can see, using COUNTIF can help find missing records in a Pivot table.

- Conditional Calculations: Calculated fields allow conditional logic (like IF statements) within your formulas. This logic lets you create calculations that vary based on other values in the pivot table. For instance, you could show the count of transactions with Prices over $20 with the formula
=COUNTIF(Price,">20").

According to this table, there were 70 transactions where the company sold aluminum for over $20.
- Cleanliness and Readability: Calculated fields can keep your pivot table cleaner and easier to understand. Complex calculations can be defined within the formula, leaving the table focused on presenting the results.
- Increased Reliability: Adding additional columns to your source data is an alternative to calculated fields. For example, you can calculate the profit margin for each transaction. However, if you add new rows to your source table, you may forget to copy the formulas to these new rows. Additionally, the new rows won’t have the additional formulas if the data is added automatically from an outside source.
As you can see, there are many opportunities to improve the usefulness of your pivot table. Hopefully, some of these examples will help you with your next spreadsheet.

Related Articles
-
5 Reasons to Use Calculated Fields in Google Sheets Pivot Tables
Learns five situations where calculated fields improve your pivot tables.
-
Multi-Sheet Pivot Tables in Google Sheets | No Formulas
Learn how to create a pivot table from data spread over multiple sheets.
-
Count Amounts by Day of the Week in Google Sheets
Learn how to count transactions by day of the week and return a table with the day names and their corresponding counts.