
An office move changes every employee’s commute, and not always in the same direction. Before you sign a lease, it helps to know who gains, who loses, and by how much.
This tutorial uses the Route Matrix add-on to compare rush-hour commutes to your current office and each possible new location in Google Sheets, using real drive times with traffic and no API key or code.
What You’ll Build
By the end, you’ll have a grid of morning commutes with employees down the side and offices across the top, a total for each office, the longest commute at each one, and the change for every employee compared with today.
Step 1: Enter Both Lists on One Tab
Route Matrix reads both lists from the same tab, so put them side by side and leave a column empty between them. List your current office first, so it becomes the first column of results:
| A | B | C | D | E | |
|---|---|---|---|---|---|
| 1 | Employee | Home | Office | Address | |
| 2 | Employee A | Concord, NC | Current Office | Charlotte, NC | |
| 3 | Employee B | Gastonia, NC | Huntersville | Huntersville, NC | |
| 4 | Employee C | Fort Mill, SC | Matthews | Matthews, NC |
Home addresses are personal, so think about who can open this sheet. You don’t need exact addresses for a decision like this: a ZIP code or a nearby intersection gives a good enough commute estimate. Use labels such as Employee A if you plan to share the results.
Step 2: Open Route Matrix
Install Route Matrix from the Google Workspace Marketplace if you haven’t already. It opens from the add-ons side panel on the right of your sheet; click the Route Matrix icon there.
Step 3: Make Homes the Starting Addresses
- Set Sheet with Address Data to the tab with your two lists
- Set Range of Starting Address(es) to the home locations (B2:B4)
- Set Range of Ending Address(es) to the offices (E2:E4)
Homes as the starting addresses gives you the morning commute. To show names instead of addresses, tick Use custom labels for locations and enter A2:A4 as the origin labels and D2:D4 as the destination labels. Each full address is kept in a note on its name.
Step 4: Set a Rush-Hour Departure Time
- Output: Time
- Route Type: Driving
- Formatting: Formatted, for colored headers and a green-to-red scale on the totals
- Totals: Column sums
- Departure Time: click Show more, then pick a future weekday and a typical start, such as 8:00am
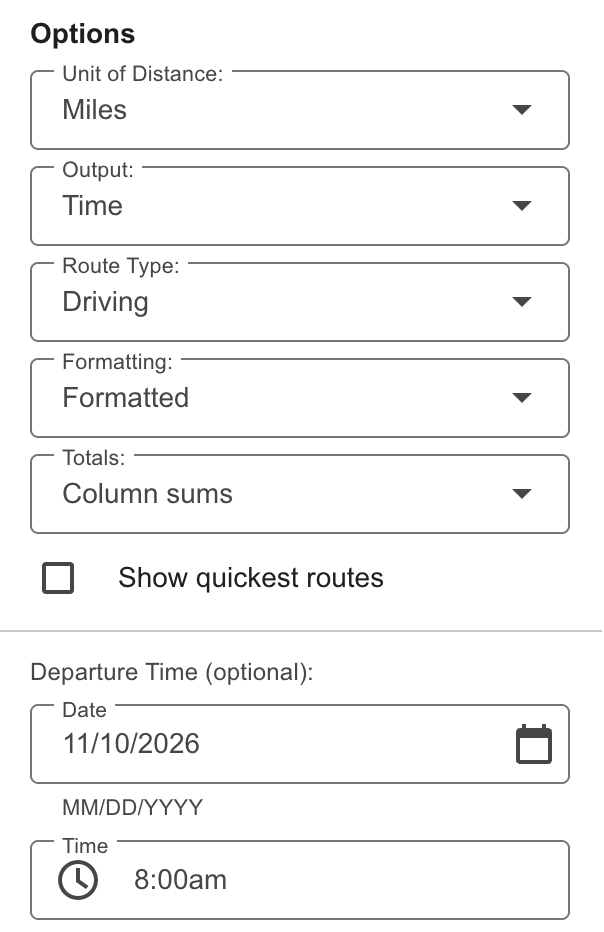
Don’t skip the departure time. Without one, Route Matrix returns drive times without traffic, which can give you the wrong answer. In this example, a run of the same addresses at 3:00 in the morning puts Current Office first with a total of 1:23, while the 8:00 a.m. run below puts Huntersville first.
The time is read in the spreadsheet’s time zone, so check it under File > Settings if the offices are somewhere else.
Step 5: Click RUN and Compare the Totals
Click RUN. Route Matrix adds a new tab with a short summary of the run at the top, followed by the grid. The Column Total row adds up everyone’s commute to each office, colored green for the lowest and red for the highest.
In this example, Huntersville has the lowest total at 2 hours 20 minutes. Current Office and Matthews are both about 2:25, so on totals alone neither new site looks like a big change.
Step 6: See Who Gains and Who Loses
Totals hide what happens to each person, so add a column for each new office. The grid starts in row 12 because the run summary fills the rows above it. If you didn’t use custom labels, everything sits one row higher, so adjust the row numbers below. In this example the times are in rows 13 to 15, Current Office is in column B, Huntersville is in column C, and Matthews is in column D.
Type Huntersville vs. Current in F12 and Matthews vs. Current in G12. Enter this formula in F13, enter the same formula with D instead of C in G13, and fill both down:
=C13-$B13A negative result means a shorter commute than today. To see the worst case at each office, type Longest Commute in A17, enter =MAX(B13:B15) in B17, and fill it across to D17.
The add-on keeps seconds, so a difference or total can look a minute off from the times shown.

Step 7: Read the Results
Huntersville is the safer move. Employee A saves 7 minutes, Employee B’s commute barely changes, and Employee C’s stays the same. Nobody’s morning gets meaningfully worse.
Matthews has about the same total as today, but it reshuffles who pays for it. Employee C saves 19 minutes, Employee B adds 14, and the longest commute rises to 1 hour 1 minute. That’s the kind of change a total alone would never show you.
How Much It Costs
Runs of up to 9 routes are free. A route is one starting location paired with one ending location, so this 3 × 3 example is 9 routes and costs nothing. Larger runs use paid routes, at $15 for 1,000 or $50 for 5,000, which you can also buy inside the add-on. RUN asks before spending any paid routes.
A driving route with a departure time includes traffic and counts as two. For example, 50 employees and 3 offices is 150 routes, which uses 300 paid routes with traffic, about $4.50 worth from a pack of 1,000.
Related Tutorials
- How to Make a Distance Matrix in Google Sheets covers the grid itself
- How to Find the Nearest Location for Each Address shows which office is closest for each employee
- Regional Compensation looks at commutes and pay across locations
Frequently Asked Questions
Can I check the evening commute too?
Yes. Do a second run with the offices as the starting addresses and the homes as the ending addresses, and pick a future evening departure time.
Why does a future departure time matter?
Traffic estimates need a time to work from, and that time has to be in the future. Pick a normal weekday rather than a holiday.
Is the traffic exact?
No. It’s Google’s prediction for that day and time, so treat it as a typical commute rather than a guarantee.
Do I need a Google Maps API key?
No. Route Matrix works without an API key or any code.
Get Started
Install Route Matrix and try it with your own team. Up to 9 routes per run are free.